Figure 1. 2023 Population Estimates for Individuals Residing Within the North Bay Parry Sound District Health Unit Region, by Sex and Age Group
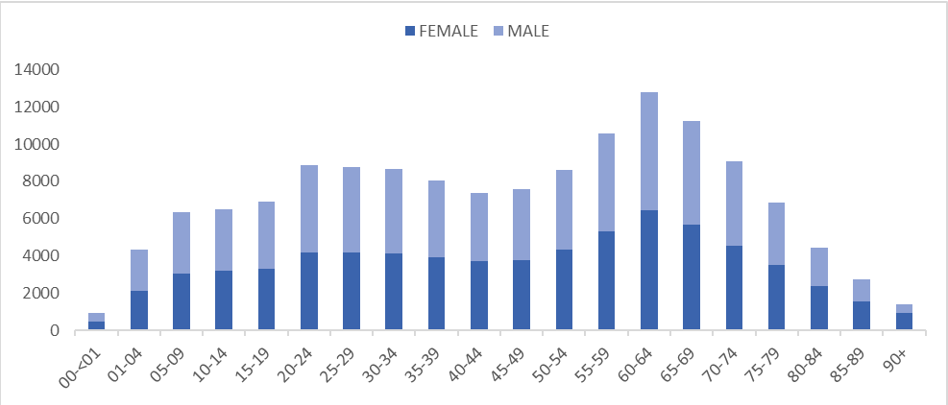
Figure 1. Population estimates for the Health Unit region
Figure 1. 2023 Population Estimates for Individuals Residing Within the North Bay Parry Sound District Health Unit Region, by Sex and Age Group
Figure 2. Population estimates for children and seniors within the Health Unit region
Figure 2. Population estimates for children and seniors within the Health Unit region, by year
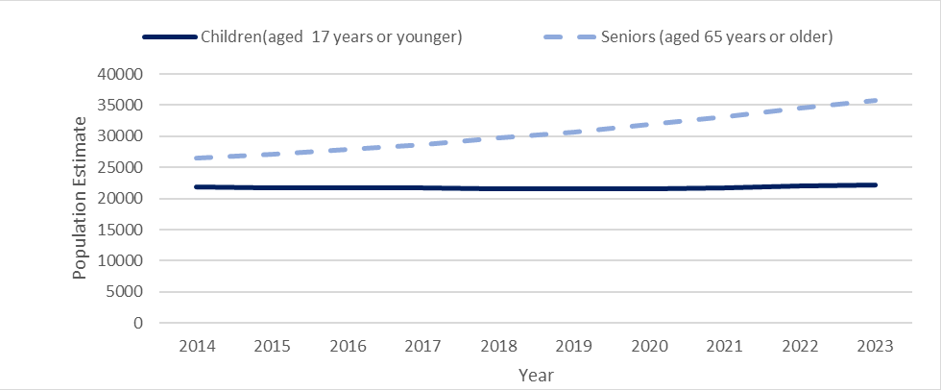
Table 1. Population estimates for the Health Unit region
Table 1. 2023 Population Estimates for Individuals Residing Within the North Bay Parry Sound District Health Unit Region, by Sex and Age Group
|
Age Group (Years) |
Females |
Males |
Total |
|
0-4 |
2,557 |
2,693 |
5,250 |
|
5-9 |
3,045 |
3,310 |
6,355 |
|
10-14 |
3,209 |
3,313 |
6,522 |
|
15-19 |
3,309 |
3,595 |
6,904 |
|
20-24 |
4,166 |
4,722 |
8,888 |
|
25-29 |
4,189 |
4,594 |
8,783 |
|
30-34 |
4,137 |
4,514 |
8,651 |
|
35-39 |
3,908 |
4,116 |
8,024 |
|
40-44 |
3,732 |
3,660 |
7,392 |
|
45-49 |
3,746 |
3,852 |
7,598 |
|
50-54 |
4,352 |
4,266 |
8,618 |
|
55-59 |
5,304 |
5,275 |
10,579 |
|
60-64 |
6,472 |
6,343 |
12,815 |
|
65-69 |
5,653 |
5,592 |
11,245 |
|
70-74 |
4,538 |
4,521 |
9,059 |
|
75-79 |
3,496 |
3,371 |
6,867 |
|
80-84 |
2,367 |
2,058 |
4,425 |
|
85-89 |
1,527 |
1,196 |
2,723 |
|
90+ |
920 |
493 |
1,413 |
|
Total |
70,627 |
71,484 |
142,111 |
Table 2. Population estimates for the adjusted Nipissing district
Table 2. Population Estimates for Individuals Residing Within the Adjusted Nipissing District, by Age Group and Planning Area, 2023
|
Age Group (Years) |
North Bay |
East Nipissing |
West Nipissing |
Total |
|
0-4 |
2,197 |
575 |
494 |
3,266 |
|
5-9 |
2,686 |
624 |
644 |
3,954 |
|
10-14 |
2,766 |
733 |
667 |
4,166 |
|
15-19 |
3,119 |
644 |
664 |
4,427 |
|
20-24 |
5,151 |
689 |
465 |
6,305 |
|
25-29 |
4,936 |
756 |
472 |
6,164 |
|
30-34 |
4,163 |
810 |
660 |
5,633 |
|
35-39 |
3,671 |
808 |
724 |
5,203 |
|
40-44 |
3,192 |
760 |
697 |
4,649 |
|
45-49 |
3,192 |
760 |
697 |
4,649 |
|
50-54 |
3,304 |
883 |
889 |
5,076 |
|
55-59 |
3,687 |
1,111 |
1,034 |
5,832 |
|
60-64 |
4,144 |
1,336 |
1,256 |
6,736 |
|
65-69 |
3,564 |
1,135 |
1,119 |
5,818 |
|
70-74 |
2,953 |
735 |
1,024 |
4,712 |
|
75-79 |
2,301 |
495 |
750 |
3,546 |
|
80-84 |
1,791 |
260 |
390 |
2,441 |
|
85-89 |
1,061 |
203 |
276 |
1,540 |
|
90+ |
574 |
83 |
136 |
793 |
|
Total |
58,388 |
13,423 |
13,615 |
84,976 |
Table 3. Population estimates for Parry Sound district
Table 3. Population Estimates for Individuals Residing Within the Parry Sound District, by Age Group and Planning Area, 2023
|
Age Group (Years) |
North East Parry Sound |
South East Parry Sound |
West Parry Sound |
Total |
|
0-4 |
458 |
690 |
836 |
1,984 |
|
5-9 |
477 |
952 |
972 |
2,401 |
|
10-14 |
485 |
960 |
911 |
2,356 |
|
15-19 |
422 |
935 |
1,120 |
2,477 |
|
20-24 |
385 |
1,177 |
1,021 |
2,583 |
|
25-29 |
524 |
1,053 |
1,042 |
2,619 |
|
30-34 |
686 |
1,055 |
1,277 |
3,018 |
|
35-39 |
619 |
1,036 |
1,166 |
2,821 |
|
40-44 |
585 |
1,056 |
1,102 |
2,743 |
|
45-49 |
547 |
1,161 |
1,175 |
2,883 |
|
50-54 |
709 |
1,307 |
1,526 |
3,542 |
|
55-59 |
1,045 |
1,532 |
2,170 |
4,747 |
|
60-64 |
1,358 |
1,877 |
2,844 |
6,079 |
|
65-69 |
1,273 |
1,646 |
2,508 |
5,427 |
|
70-74 |
1,005 |
1,313 |
2,029 |
4,347 |
|
75-79 |
715 |
983 |
1,623 |
3,321 |
|
80-84 |
339 |
592 |
1,053 |
1,984 |
|
85-89 |
197 |
309 |
677 |
1,183 |
|
90+ |
85 |
175 |
360 |
620 |
|
Total |
11,914 |
19,809 |
25,412 |
57,135 |
Table 4. Population estimates for children (aged 17 years or younger) within the Health Unit region
Table 4. Population Estimates for Children (aged 17 years or younger) Within the Health Unit Region, by District and Year
|
Year |
Adjusted Nipissing district |
Parry Sound district |
Health Unit Region |
|
2014 |
15,204 |
6,597 |
21,801 |
|
2015 |
15,165 |
6,610 |
21,775 |
|
2016 |
15,073 |
6,687 |
21,760 |
|
2017 |
14,915 |
6,749 |
21,664 |
|
2018 |
14,740 |
6,846 |
21,586 |
|
2019 |
14,707 |
6,889 |
21,596 |
|
2020 |
14,638 |
6,943 |
21,581 |
|
2021 |
14,793 |
7,002 |
21,795 |
|
2022 |
14,880 |
7,080 |
21,960 |
|
2023 |
14,887 |
7,220 |
22,107 |
Table 5. Population estimates for seniors (aged 65 years and older) within the Health Unit area
Table 5. Population Estimates for Seniors (aged 65 years and older) Within the Health Unit Region, by District and Year
|
Year |
Adjusted Nipissing district |
Parry Sound district |
Health Unit Region |
|
2014 |
15,825 |
10,726 |
26,551 |
|
2015 |
16,097 |
10,999 |
27,096 |
|
2016 |
16,477 |
11,402 |
27,879 |
|
2017 |
16,926 |
11,792 |
28,718 |
|
2018 |
17,345 |
12,381 |
29,726 |
|
2019 |
17,815 |
12,894 |
30,709 |
|
2020 |
18,358 |
13,578 |
31,936 |
|
2021 |
18,899 |
14,323 |
33,222 |
|
2022 |
19,548 |
14,922 |
34,470 |
|
2023 |
20,173 |
15,559 |
35,732 |
Definitions, data sources and methodology
Definitions:
Population estimates: Population counts based on census subdivision populations.
Adjusted Nipissing district: Only includes municipalities served by the North Bay Parry Sound District Health Unit; excludes South Algonquin, Temagami, and Bear Island.
Data sources:
Statistics Canada 2023, Ontario Ministry of Health, IntelliHEALTH Ontario, Date Extracted: 2025/01/31. The original data source is the Demography Division of Statistics Canada.
Methodology:
Population estimates are based on the census counts adjusted for net undercoverage beginning with the 1986 census. Population estimates are final intercensal estimates that are interpolated using the adjusted census counts for the census years around the year that the estimates are for. Population estimates beyond the most recent census onwards are extrapolated by applying the growth rates by age and sex of each census division (CD) to the census subdivisons that comprise that CD.
For more details on this methodology, please see: "Postcensal estimates of census subdivisions population by age and sex” (April 2015) produced by Statistics Canada.