Health Unit Region Population Estimates
- The 2023 population estimate for the North Bay Parry Sound District Health Unit (Health Unit) region is 142,111 individuals. Between 2014 and 2023, the regional population increased significantly by 14,919 individuals or 11.7%.
Population for Health Unit region:
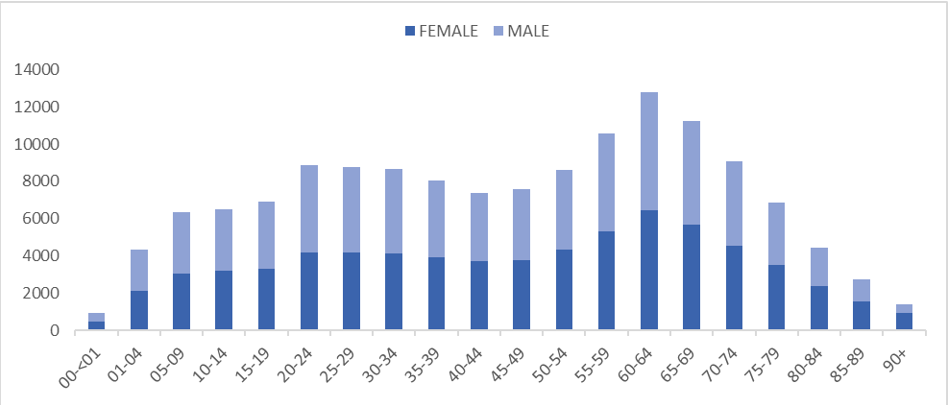
- The age groups that comprised the highest percentage (nearly one-third) of our regional population were adults aged 55 to 74 years, compared to Ontario where 20 to 39 year olds were the age groups most represented in the population (see Figure 1; Table 1).
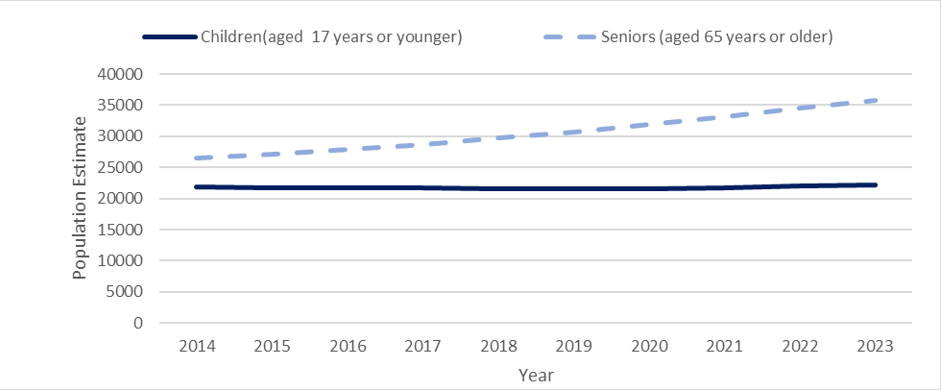
- The population of children aged 17 years or younger has not significantly changed between 2014 and 2023 (see Figure 2). In comparison, the population of seniors (adults aged 65 years or older) has increased significantly by about 34.6%.
- The distribution of sex remains balanced for most age groups, with males and females each representing between 46.5% and 53.5% of the total. The exception is among adults aged 85 years and older: females represented 56.1% of the population aged 85 to 89 years, and 65.1% of those aged 90 years or older (see Figure 1; Table 1).
Population for Nipissing and Parry Sound Districts:
-
In the adjusted Nipissing district, adults aged 55 to 64 years old were the most represented age groups in the population (14.8%; see Table 2). Conversely, adults aged 20 to 29 years were the most represented age groups in North Bay and adults aged 60 to 69 years in the East Nipissing area and West Nipissing area.
-
In the Parry Sound district, adults aged 60 to 69 years comprised the highest percentage of the population (20.1%; see Table 3). Similarly, the same age groups were the most represented in the population of the North East Parry Sound area, West Parry Sound area, and the South East Parry Sound area.
-
Of the municipalities served by the Health Unit within the adjusted Nipissing district, the population increased significantly by 7675 individuals between 2014 and 2023. In the Parry Sound district, the population has increased significantly by 7244 individuals since 2014.
-
In the adjusted Nipissing district, the population of children aged 17 years or younger has decreased significantly by 2.1%, compared to 9.4% increasing significantly in the Parry Sound district between 2014 and 2023 (see Table 4).
-
The senior population (adults aged 65 years and older) has increased significantly by 27.5% in the adjusted Nipissing district and 45.1% in the Parry Sound district between 2014 and 2023 (see Table 5).
| Figure 1. Population estimates for the Health Unit region | |||||||||||||||||||||||||||||||||||||||||||||||||||||||||||||||||||||||||||||||||||||||||||||||||||||||||
|
Figure 1. 2023 Population Estimates for Individuals Residing Within the North Bay Parry Sound District Health Unit Region, by Sex and Age Group
|
|||||||||||||||||||||||||||||||||||||||||||||||||||||||||||||||||||||||||||||||||||||||||||||||||||||||||
| Figure 2. Population estimates for children and seniors within the Health Unit region | |||||||||||||||||||||||||||||||||||||||||||||||||||||||||||||||||||||||||||||||||||||||||||||||||||||||||
|
Figure 2. Population estimates for children and seniors within the Health Unit region, by year
|
|||||||||||||||||||||||||||||||||||||||||||||||||||||||||||||||||||||||||||||||||||||||||||||||||||||||||
| Table 1. Population estimates for the Health Unit region | |||||||||||||||||||||||||||||||||||||||||||||||||||||||||||||||||||||||||||||||||||||||||||||||||||||||||
|
Table 1. 2023 Population Estimates for Individuals Residing Within the North Bay Parry Sound District Health Unit Region, by Sex and Age Group
|
|||||||||||||||||||||||||||||||||||||||||||||||||||||||||||||||||||||||||||||||||||||||||||||||||||||||||
| Table 2. Population estimates for the adjusted Nipissing district | |||||||||||||||||||||||||||||||||||||||||||||||||||||||||||||||||||||||||||||||||||||||||||||||||||||||||
|
Table 2. Population Estimates for Individuals Residing Within the Adjusted Nipissing District, by Age Group and Planning Area, 2023
|
|||||||||||||||||||||||||||||||||||||||||||||||||||||||||||||||||||||||||||||||||||||||||||||||||||||||||
| Table 3. Population estimates for Parry Sound district | |||||||||||||||||||||||||||||||||||||||||||||||||||||||||||||||||||||||||||||||||||||||||||||||||||||||||
|
Table 3. Population Estimates for Individuals Residing Within the Parry Sound District, by Age Group and Planning Area, 2023
|
|||||||||||||||||||||||||||||||||||||||||||||||||||||||||||||||||||||||||||||||||||||||||||||||||||||||||
| Table 4. Population estimates for children (aged 17 years or younger) within the Health Unit region | |||||||||||||||||||||||||||||||||||||||||||||||||||||||||||||||||||||||||||||||||||||||||||||||||||||||||
|
Table 4. Population Estimates for Children (aged 17 years or younger) Within the Health Unit Region, by District and Year
|
|||||||||||||||||||||||||||||||||||||||||||||||||||||||||||||||||||||||||||||||||||||||||||||||||||||||||
| Table 5. Population estimates for seniors (aged 65 years and older) within the Health Unit area | |||||||||||||||||||||||||||||||||||||||||||||||||||||||||||||||||||||||||||||||||||||||||||||||||||||||||
|
Table 5. Population Estimates for Seniors (aged 65 years and older) Within the Health Unit Region, by District and Year
|
|||||||||||||||||||||||||||||||||||||||||||||||||||||||||||||||||||||||||||||||||||||||||||||||||||||||||
| Definitions, data sources and methodology | |||||||||||||||||||||||||||||||||||||||||||||||||||||||||||||||||||||||||||||||||||||||||||||||||||||||||
|
Definitions: Population estimates: Population counts based on census subdivision populations. Adjusted Nipissing district: Only includes municipalities served by the North Bay Parry Sound District Health Unit; excludes South Algonquin, Temagami, and Bear Island. Data sources: Statistics Canada 2023, Ontario Ministry of Health, IntelliHEALTH Ontario, Date Extracted: 2025/01/31. The original data source is the Demography Division of Statistics Canada. Methodology: Population estimates are based on the census counts adjusted for net undercoverage beginning with the 1986 census. Population estimates are final intercensal estimates that are interpolated using the adjusted census counts for the census years around the year that the estimates are for. Population estimates beyond the most recent census onwards are extrapolated by applying the growth rates by age and sex of each census division (CD) to the census subdivisons that comprise that CD. For more details on this methodology, please see: "Postcensal estimates of census subdivisions population by age and sex” (April 2015) produced by Statistics Canada. |