Community Data and Reports

Skip to Content

North Bay Parry Sound District Health Unit Logo North Bay Parry Sound District Health Unit Logo Print

Contact Us
  • Public Health
    Services
    • Breastfeeding Clinic
    • Community Events and Farmers Markets
    • Dental Clinic
    • Family Health Information Line
    • Food Safety Certification Training
    • Healthy Babies, Healthy Children
    • Infection Prevention and Control Investigations
    • Inspection Results and Enforcement
    • Needle Syringe Program
    • Planet Youth Nipissing
    • Prenatal Classes
    • Private Drinking Water Testing
    • The Sexual Health Clinic
    • Vaccination Clinics
    • Vaccination Records
  • Health
    Topics
    • 2SLGBTQ+
    • Air Quality
    • Alcohol
    • Animal Bites
    • Beach, Lake and Pool Water
    • Breastfeeding
    • Cancer Prevention and Screening
    • Cannabis
    • Climate Change
    • Dental Health
    • Diseases
    • Drinking Water
    • Emergencies and Being Prepared
    • Farm Fresh Eggs
    • Flu/Influenza
    • Food Safety
    • Gambling
    • Hand Hygiene
    • Healthy Aging
    • Healthy Eating
    • Heat and Humidity
    • Home Health and Safety
    • Housing and Homelessness
    • Injury Prevention
    • Intimate Partner Violence
    • Mental Health
    • Naloxone
    • Pregnancy, Infant and Child Health
    • Perfluoroalkylated Substances (PFAS)
    • Physical Activity
    • Racism
    • Radiation
    • Reducing Weight Bias
    • Sexual Health
    • Sharps
    • Smoking, Vaping and Tobacco
    • Substance Use
    • Suicide Prevention
    • Vaccinations
    • Vision Health
  • Health Professionals
    and Partners
    • Camp Providers
    • Child Cares
    • Cooling Tower Property Owners and Maintenance Operators
    • COVID-19 Healthcare Providers, Hospitals and Long-Term Care
    • Designated Officers
    • Emergency Management
    • Group Home and Shelter Administrators
    • Health Care Professionals
    • Health Care Providers COVID-19 Vaccine Information
    • Healthy Aging Resources
    • Long-Term Care and Retirement Homes
    • Maternal Child Update
    • Municipal Resources
    • Needle Syringe Programs
    • Nutrition Resources
    • Ontario Naloxone Program (ONP) Distributing Agencies and First Responders
    • Personal Service Settings
    • Report an Overdose
    • Schools
    • Teaching Kitchen
  • Community Data
    and Reports
    • Child and Youth Health Data
    • Chronic Diseases
    • Environmental Health
    • Health Behaviours
    • Indirect Impacts of COVID-19
    • Infectious Diseases
    • Injuries
    • Mortality
    • Nipissing Parry Sound Public Health Atlas
    • Oral Health
    • Population Demographics
    • Reproductive and Child Health
    • Respiratory Dashboard
    • Substance Use Harms
    • Well-being and Mental Health
  • About Us
    • About Us
    • Accessibility
    • Board of Health
    • Careers and Placements
    • Contact Us
    • Interview with Isabel Churcher
    • News and Events
    • Personal Health Privacy Policy
    • Programs and Services
    • RFPs and Tenders
    • 2024-2027 Strategic Plan
Search Button

Back To Top

Child and Youth Health Data

HomeCommunity Data and ReportsChild and Youth Health Data
  • Open new window to share this page via Facebook Facebook
  • Open new window to share this page via Twitter Twitter
  • Open new window to share this page via LinkedIn LinkedIn
  • Email this page Email

Ontario Student Drug Use and Health Survey

In the 2022/2023 school year, the Health Unit was involved in an oversample of the Ontario Student Drug Use and Health Survey (OSDUHS) conducted by the Centre for Addiction and Mental Health (CAMH). This oversample included fourteen elementary schools (361 students across grades 7 and 8) and six secondary schools (374 students in grades 9-12) in the Health Unit district. The sample consisted of 48% females and 52% males with the highest proportions of students in grade 12 and aged 16–17-years-old (Figures 1 & 2). What follows is an insight into self reported mental health, physical health, substance use, and health behaviours among students.
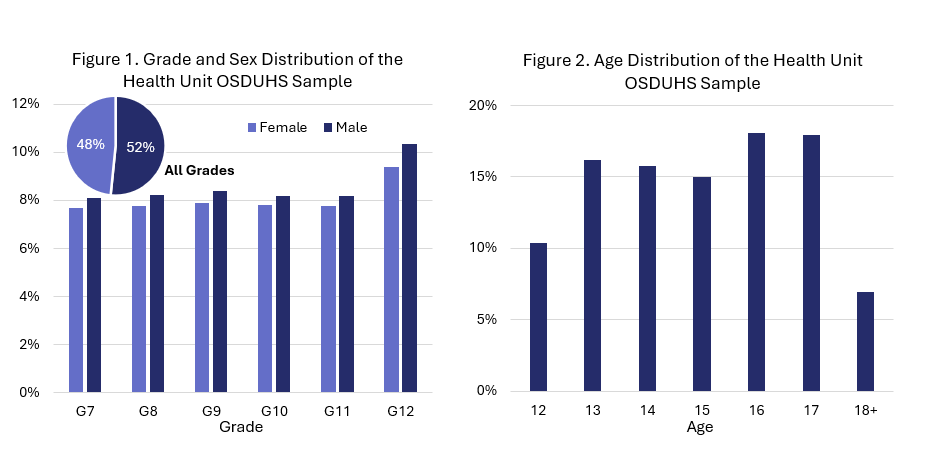
Graphs showing sample size of students who completed survey

Note: Data from the 2023 Ontario Student Drug Use and Health Survey (OSDUHS) were provided by The Centre for Addiction and Mental Health (CAMH) and the Institute for Social Research (ISR), York University. The 2023 cycle of the survey was completed under the direction of the CAMH OSDUHS Survey Group: Dr. Hayley Hamilton and Angela Boak. Neither CAMH nor the ISR are responsible for the analyses and interpretations presented here.

To request access to the 2014-2015 OSDUHS reports, please contact research@healthunit.ca.

Youth Mental Health and Well-being
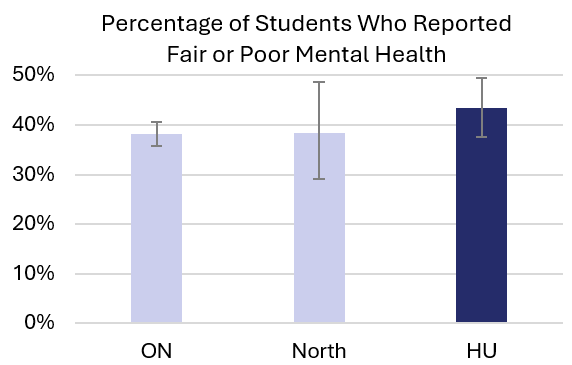
  • 43.4% of Health Unit (HU) region students reported fair or poor mental health which is similar to Ontario (38.1%) and Northern Ontario (38.4%) students (Figure 1).
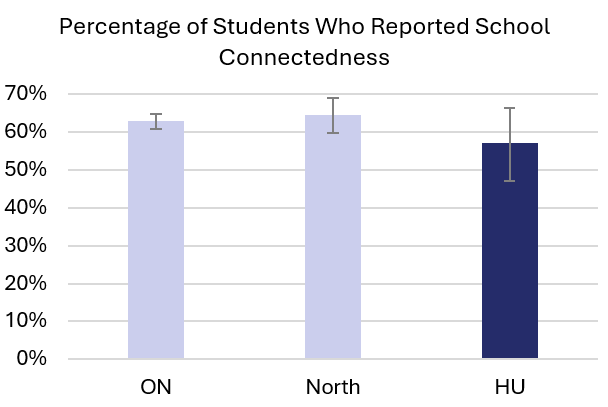
  • 57% of students in the HU region reported feeling connected to their school (responded somewhat agree or strongly agree to feeling safe in their school, close to people at the school and feeling like they are a part of the school) which is similar to that of Ontario (62.8%) and Northern Ontario (64.5%) students (Figure 2).
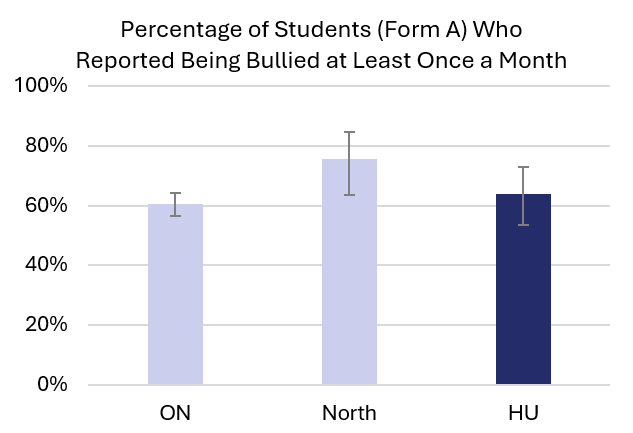
  • 63.8% of students in the HU region reported being bullied at least once a month or more since the beginning of the school year which is higher than but not statistically different than 60.4% of Ontario students who were bullied (Figure 3). 44% of HU region students also reported online bullying, and 52.4% reported being teased or picked on about their weight at least once in the last 12 months.
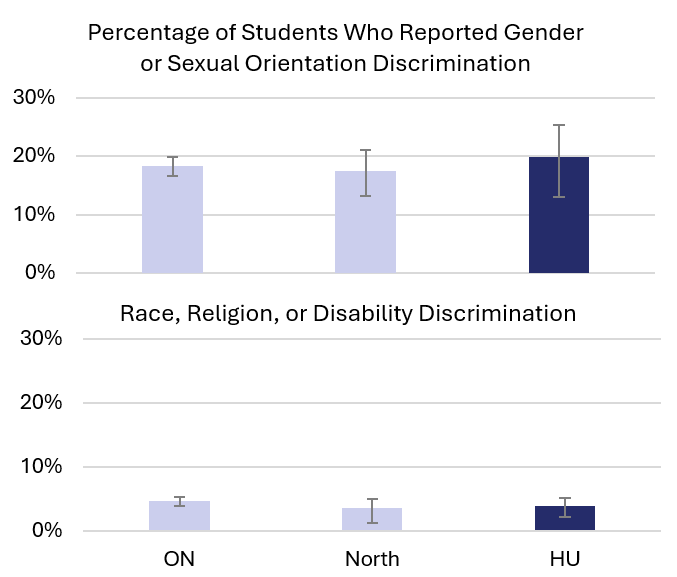
  • There were no regional differences in students reporting gender, sexual orientation, race/ethnicity, religion or disability discrimination with 1 in 5 HU students reporting gender or sexual orientation discrimination and 4% reporting race/ethnicity, religion or disability discrimination (Figure 4). Gender and sexual orientation discrimination questions were only asked to secondary school students.
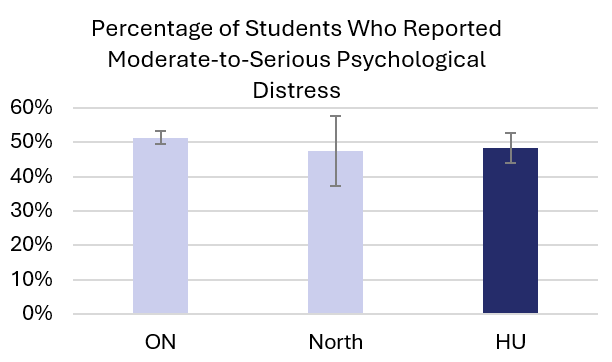
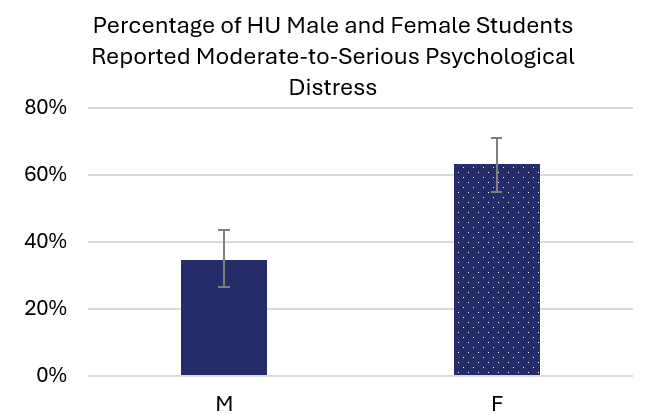
  • Almost one half (48.3%) of HU region students met the criteria for moderate-to-serious psychological distress in the last month with female students being 1.8 times more likely to meet these criteria compared to males (63.3% versus 34.5%, respectively; Figure 5 & 6).


Percentage of students who reported their mental health as fair or poor

Figure 1. A graph comparing the percentage of students in the North Bay Parry Sound District Health Unit region (HU), Northern Ontario (North) and all of Ontario (ON) who reported their mental health as fair or poor.


Students who reported feeling connect to school and peers
Figure 2. A graph comparing the percentage of students in the North Bay Parry Sound District Health Unit region (HU), Northern Ontario (North) and all of Ontario (ON) who reported feeling connected to their school and peers (responded somewhat agree or strongly agree to feeling safe in their school, close to people at the school and feeling like they are a part of the school).
 

Percentage of students who reported being bullied

Figure 3. A graph comparing the percentage of students who completed form A in the North Bay Parry Sound District Health Unit region (HU), Northern Ontario (North) and all of Ontario (ON) who reported being bullied at least once a month or more since the beginning of the school year.


Percentage of students who reported perceived discriminationFigure 4. A graph comparing the percentage of students in the North Bay Parry Sound District Health Unit region (HU), Northern Ontario (North) and all of Ontario (ON) who reported perceived discrimination at school based on race/ethnicity, religion, disability, gender, or sexual orientation.

Percentage of students who reported feeling moderate-to-serious psychological distress

Figure 5. A graph comparing the percentage of students in the North Bay Parry Sound District Health Unit region (HU), Northern Ontario (North) and all of Ontario (ON) who reported feeling moderate-to-serious psychological distress in the last four weeks by scoring 8+ on the Kessler 6-item Psychological Distress Scale.
Comparing a subset of male and female students who scored 8 or more on the distress scale

Figure 6. A graph comparing a subset of male and female students from the Health Unit region who scored 8 or more on the Kessler 6-item Psychological Distress Scale which indicates moderate-to-serious psychological distress.

Youth Health Behaviours and Physical Health

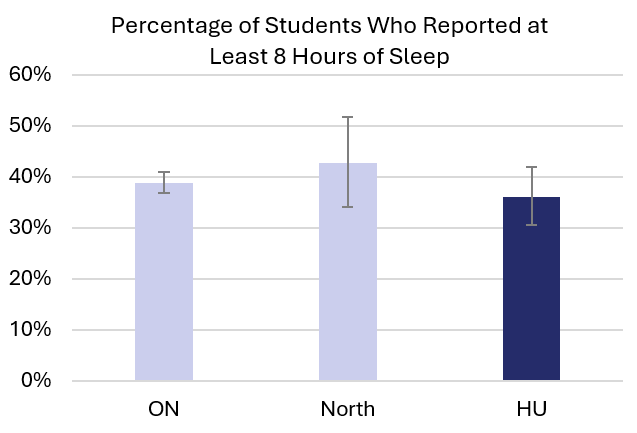
  • 36.1% of HU students reported sleeping at least 8 hours on an average school night which is similar to Northern Ontario (42.7%) and Ontario (38.9%) students (Figure 1).
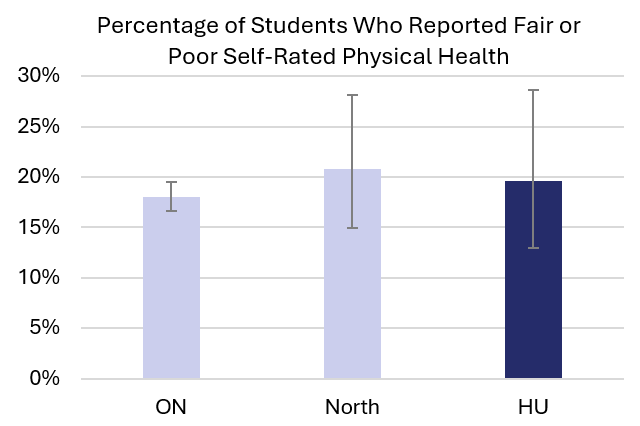
  • 19.6% of HU students rated their physical health as either fair or poor which is similar to the 20.8% of Northern Ontario students and 18.1% of Ontario students who reported the same (Figure 2).
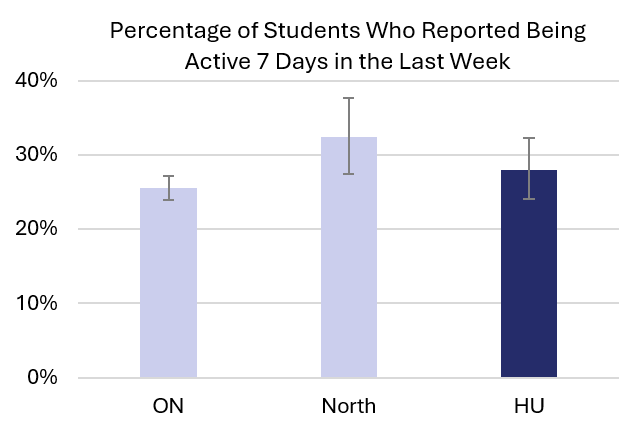
  • 28% of HU students reported 7 days of physical activity in the last week which is similar to percentages in Northern Ontario (32.4%) and Ontario (25.5%; Figure 3).
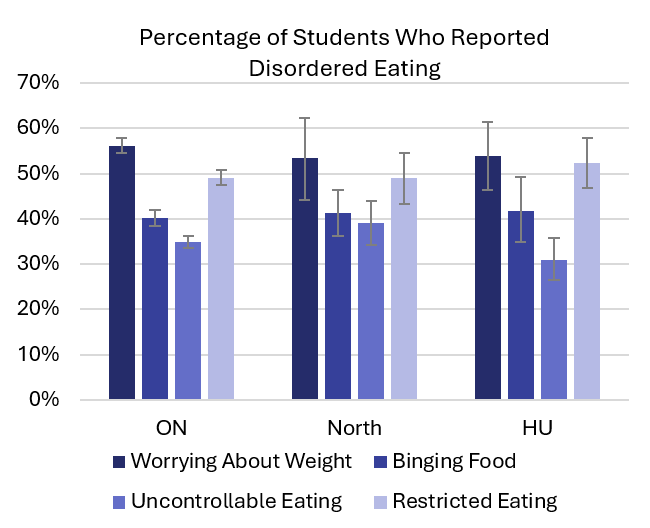
  • 53.9%, 41.8%, 30.9% and 42.4% of HU students reported worrying about weight, binging food, uncontrollable eating, and restricted eating, respectively. These percentages are similar to that of students in all of Ontario and Northern Ontario (Figure 4). Note, this includes worrying about weight sometimes, often or always, and binging food, eating uncontrollably, and restricting eating (not eat or eat in a way to change your weight, shape or muscles) at least once a month.
  • 12.3% of HU students consumed a sugary drink at least once a day in the last 7 days and 45.4% consumed fruits and vegetables at least three times on an average day (Figure 5).
  • 75.2% of HU region students reported three or more hours of screen time per day which was more than Northern Ontario students and slightly less than Ontario students but not statistically different (Figure 6).
Percentage of students who reported sleeping at least eight hours or moreFigure 1. A graph comparing the percentage of students in the North Bay Parry Sound District Health Unit region (HU), Northern Ontario (North) and all of Ontario (ON) who reported sleeping at least eight hours or more on an average school night.


Percentage of students who reported fair or poor self-rated physical health

Figure 2. A graph comparing the percentage of students in the North Bay Parry Sound District Health Unit region (HU), Northern Ontario (North) and all of Ontario (ON) who reported fair or poor self-rated physical health.


Percentage of students who reported at least 60 minutes of physical activity

Figure 3. A graph comparing the percentage of students in the North Bay Parry Sound District Health Unit region (HU), Northern Ontario (North), and all of Ontario (ON) who reported at least 60 minutes of physical activity each day in the last week.
 Percentage of students who reported disordered eating at least once or more 


Figure 4. A graph comparing the percentage of students in the North Bay Parry Sound District Health Unit region (HU), Northern Ontario (North), and all of Ontario (ON) who reported disordered eating at least once or more over the last four weeks.
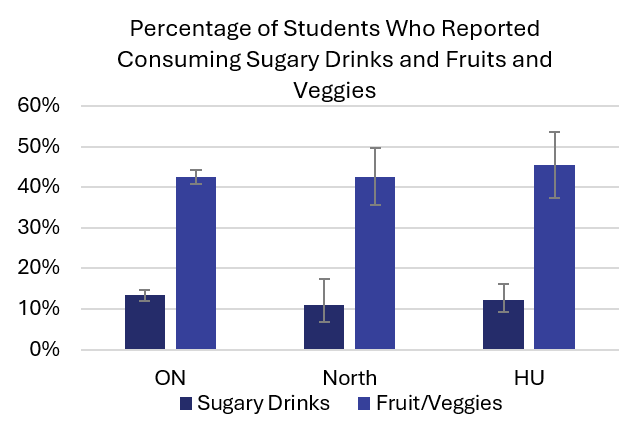
 

Percentage of students who reported consuming sugary drinks and fruits and vegetables

Figure 5. A graph comparing the percentage of students in the North Bay Parry Sound District Health Unit region (HU), Northern Ontario (North), and all of Ontario (ON) who reported consuming fruits and vegetables at least three times on an average day and sugary drinks once or more each day for the last seven days.
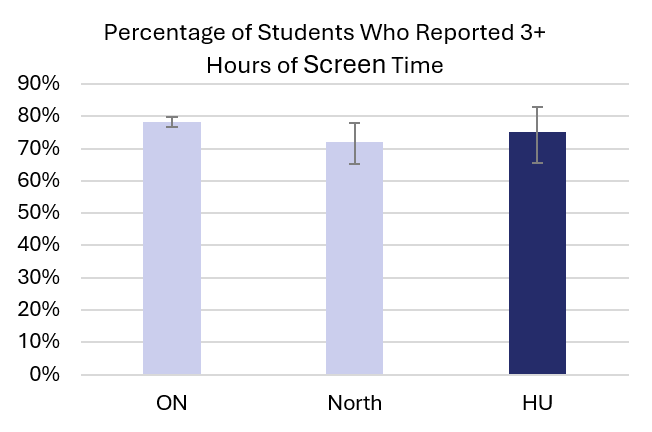


Percentage of students who reported three or more hours of screen time per day

Figure 6. A graph comparing the percentage of students in the North Bay Parry Sound District Health Unit region (HU), Northern Ontario (North), and all of Ontario (ON) who reported three or more hours of screen time per day on average in the last seven days.

Youth Substance Use

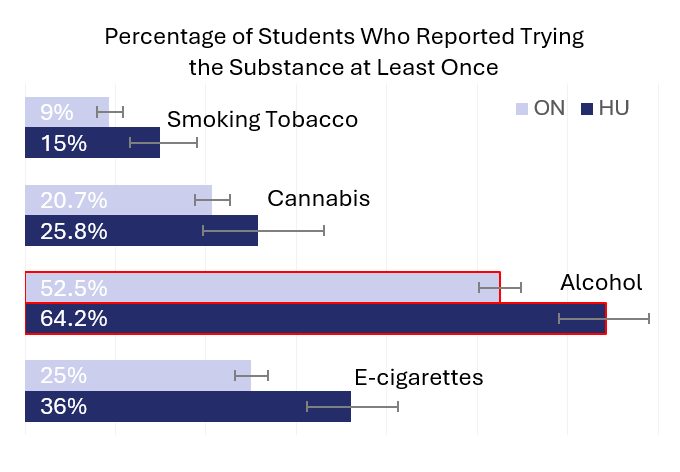
  • Students from the HU region were significantly more likely to report trying electronic cigarettes (vaping), alcohol, and tobacco cigarettes in their lifetime than Ontario students (36%, 64.2%, 15% versus 25%, 52.5%, 9% respectively; Figure 1).
  • HU students were more likely to report trying alcohol in their lifetime than any other substance, followed by e-cigarettes, cannabis, and tobacco (Figure 1). In the 12 months prior to the survey, 49.2%, 20.4%, 22.4%, and 5.5% of HU students also reported using alcohol, e-cigarettes, cannabis, and tobacco at least once, respectively.
  • The highest percentage (17.8%) of HU students reported drinking alcohol for the first time in grades 4-6, which is higher than but not statistically different than Ontario or Northern students. Alcohol initiation was more likely to occur in earlier grades compared to cannabis and vaping that had highest proportions in nineth grade (Figure 2). This graph excludes those who selected that they have not tried the substance and percentages that had a coefficient of variation over 33.33.
  • In the HU region, 17.3% of high school students scored eight or higher on the AUDIT scale which indicates harmful/hazardous drinking, this is higher than but not statistically different than Ontario (12.6%) and Northern (11.2%) students (Figure 3). Only students from grades 9 to 12 who answered all ten questions are included.
  • HU region students were just as likely to report trying ADHD medication (non-medically), prescription opioids (non-medically), cold/cough medication to get high, hallucinogens (magic mushrooms) as Ontario students, but more likely to report trying tranquilizers/sedatives (Figure 4 & 5).
Percentage of students who reported trying tobacco, cannabis, alcohol and e-cigarettes


Figure 1. A graph comparing the percentage of students from the North Bay Parry Sound District Health Unit region (HU), and Ontario (ON) who reported trying tobacco, cannabis, alcohol, and e-cigarettes at least once in their lifetime.
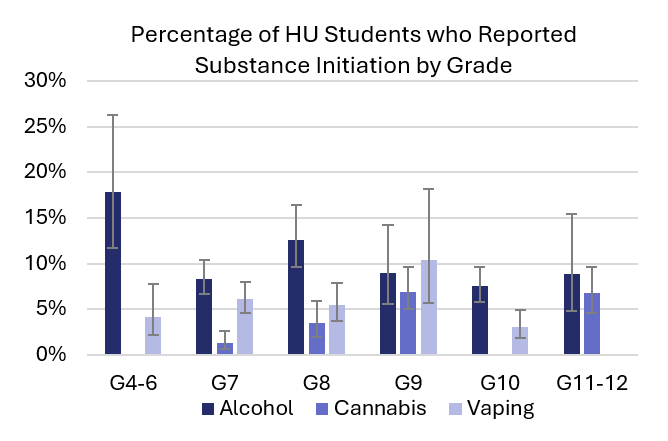
 

Percentage of students who reported the grade they first tried alcohol, cannabis, or vaping

Figure 2. A graph comparing the percentage of students from the North Bay Parry Sound District Health Unit region who reported the grade they first tried alcohol (more than a few sips), cannabis, or vaping.
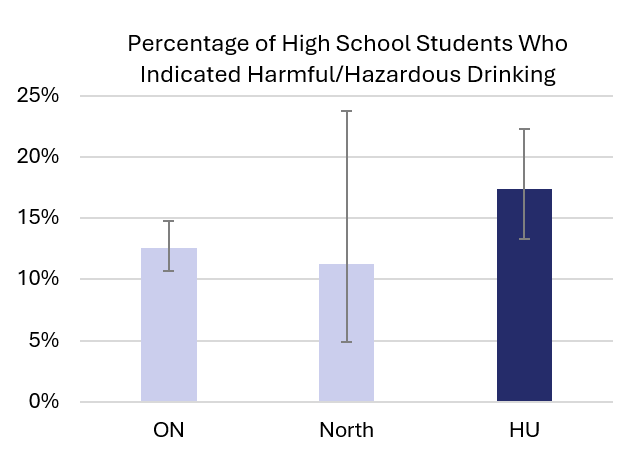
Percentage of students who scored 8 or higher on the AUDIT scale

Figure 3. A graph comparing the percentage of students in the North Bay Parry Sound District Health Unit region (HU), Northern Ontario (North), and all of Ontario (ON) who scored eight or higher on the AUDIT scale that indicates harmful/hazardous drinking.
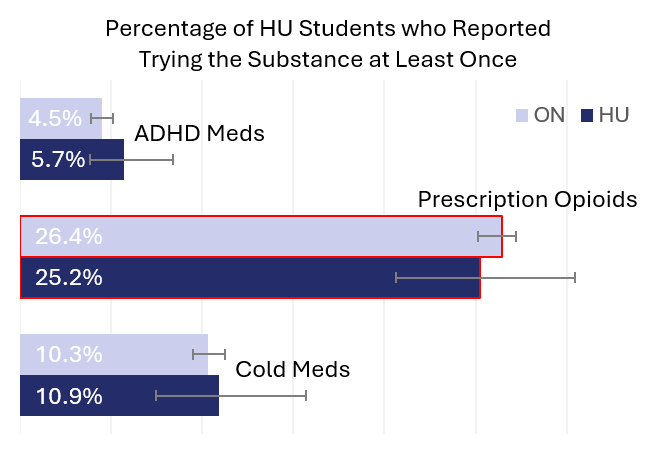
Percentage of students who reported trying the substance at least onceFigure 4. A graph comparing the percentage of students in the North Bay Parry Sound District Health Unit (HU) and Ontario (ON) who reported trying ADHD medication (non-medically), prescription opioids (non-medically) without a personal prescription, and cold/cough medication to get high at least once in their lifetime.
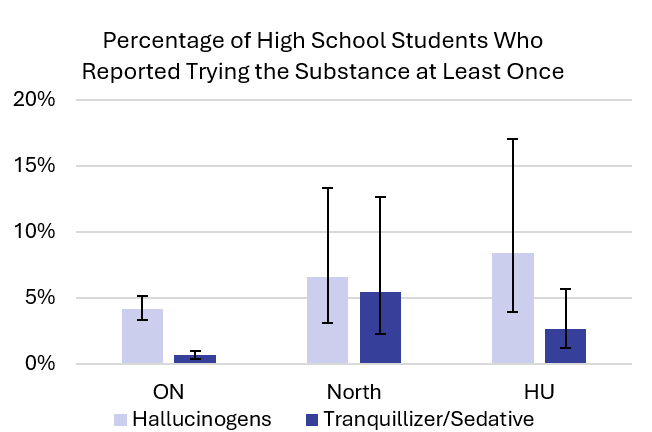
Percentage of students who reported trying hallucinogens and tranquillizers/sedatives

Figure 5. A graph comparing the percentage of high school students in the North Bay Parry Sound District Health Unit region (HU), Northern Ontario (North), and all of Ontario (ON) who reported trying hallucinogens (magic mushrooms) and tranquillizers/sedatives (non-medically) at least once in their lifetime.


Community Data and Reports
    • Child and Youth Health Data
    • Chronic Diseases
    • Environmental Health
    • Health Behaviours
    • Indirect Impacts of COVID-19
    • Infectious Diseases
    • Injuries
      Toggle Section Injuries Menu
      • Injury from Specific Cause
    • Mortality
    • Nipissing Parry Sound Public Health Atlas
    • Oral Health
    • Population Demographics
      Toggle Section Population Demographics Menu
      • Population topic areas
    • Reproductive and Child Health
      Toggle Section Reproductive and Child Health Menu
      • Child health and development
    • Respiratory Dashboard
    • Substance Use Harms
    • Well-being and Mental Health
      Toggle Section Well-being and Mental Health Menu
      • Community Well-being Dashboards
        Toggle Section Community Well-being Dashboards Menu
        • Social Determinants of Health Dashboard

Contact Us

Subscribe to this page

North Bay Parry Sound District Health Unit Footer Logo

  • Website

    • About Us
    • Employment Opportunities
    • News
  • Links

    • Accessibility
    • Privacy
    • Sitemap
    • Staff Intranet
  • Resources

    Increase Contrast

Your lifetime partner in healthy living!

Copyright 2022 North Bay Parry Sound District Health Unit

By GHD Digital

Browser Compatibility Notification

It appears you are trying to access this site using an outdated browser. As a result, parts of the site may not function properly for you. We recommend updating your browser to its most recent version at your earliest convenience.